
#elixirlang 웹소켓을 사용한 실시간 Upbit 시세 받기
웹소켓?
전형적인 브라우저 렌더링 방식은 HTTP 요청(HTTP Request)에 대한 HTTP 응답(HTTP Response)을 받아서 브라우저의 화면을 깨끗하게 지우고 받은 내용을 새로 표시하는 방식이다. 내용을 지우고 다시 그리면 브라우저의 깜빡임이 생기게 된다. 이러한 깜빡임 없이 원하는 부분만 다시 그리며 실시간으로 사용자와 상호작용하는 방식이 나타나고 사용자와 상호작용하는 웹 서비스를 선호하는 사용자가 증가하면서 RIA(Rich Internet Application) 기술의 발달이 촉진되었다.
상호작용하는 웹 서비스를 위해 숨겨진 프레임(Hidden Frame)을 이용한 방법이나 Long Polling, Stream 등 다양한 방법을 사용했다. 그러나 이러한 방식은 브라우저가 HTTP 요청을 보내고 웹 서버가 이 요청에 대한 HTTP 응답을 보내는 단방향 메시지 교환 ’규칙’을 변경하지 않고 구현한 방식이다. 그렇기 때문에 상호작용하는 웹 페이지를 복잡하고 어려운 코드로 구현해야 했다.
보다 쉽게 상호작용하는 웹 페이지를 만들려면 브라우저와 웹 서버 사이에 더 자유로운 양방향 메시지 송수신(bi-directional full-duplex communication)이 필요하다. 그래서 HTML5 표준안의 일부로 WebSocket API(이후 WebSocket)가 등장했다.
역시 표준에 추가하는 게 짱이다. 웹소켓이 HTML5 표준안에 추가되어서 이전보다 쉽게 양방향 메시지 송수신이 가능해졌다.
브라우저는 “Upgrade: WebSocket” 헤더 등과 함께 랜덤하게 생성한 키를 서버에 보낸다. 웹 서버는 이 키를 바탕으로 토큰을 생성한 후 브라우저에 돌려준다. 이런 과정으로 WebSocket 핸드쉐이킹이 이루어진다. 그 뒤 Protocol Overhead 방식으로 웹 서버와 브라우저가 데이터를 주고받는다. Protocol Overhead 방식은 여러 TCP 커넥션을 생성하지 않고 하나의 80번 포트 TCP 커넥션을 이용하고, 별도의 헤더 등으로 논리적인 데이터 흐름 단위를 이용하여 여러 개의 커넥션을 맺는 효과를 내는 방식이다.
The WebSocket Protocol is an independent TCP-based protocol. Its only relationship to HTTP is that its handshake is interpreted by HTTP servers as an Upgrade request.
HTTP가 사용하는 80 포트, HTTPS가 사용하는 443 포트를 그대로 사용한다. 웹소켓 프로토콜 핸드쉐이크(handshake)가 HTTP 리퀘스트로 시작되는 게 재미있다. 생각해보면 HTTP와 같은 포트를 사용해서 다른 방법을 찾는 게 더 어려웠을 것 같다.
거칠게 요약해보자면 요청을 안 보내도 서버가 메시지를 클라이언트에 던져줄 수 있는 양방향 메시지 송수신이 HTML5 표준안의 일부로 들어간 웹소켓으로 가능하다. 웹소켓은 TCP 기반 프로토콜이며 Protocol Overhead 방식을 사용하고 있기에 TCP 커넥션을 추가로 맺지 않고 HTTP가 사용하는 80 포트와 HTTPS가 사용하는 443 포트를 사용할 수 있다. URI 스킴(scheme)으로는 ws, wss 를 사용한다.
websockex 라이브러리를 사용해 업비트 시세를 수신하기 - commit 404da97
예제 프로그램이라서 간단하게 사용할 수 있는 websockex 라이브러리를 사용했다. 회사 프로젝트면 gun 라이브러리를 리서치했을 것이다. cowboy, ranch 라이브러리를 만든 ninenines에 속해있어 신뢰가 간다. 예제 프로그램이니 쉽게 붙일 수 있을 것 같은 라이브러리를 선택했다.
defmodule ExampleWebsocketUpbit.Client do
  use WebSockex

  def start_link(url) do
    WebSockex.start_link(url, __MODULE__, :ok, name: __MODULE__)
  end

  def send_message(msg) do
    WebSockex.cast(__MODULE__, {:send, {:text, msg}})
  end

  def handle_connect(_conn, state) do
    Logger.notice("Connected!")
    {:ok, state}
  end

  def handle_frame({type, msg}, state) do
    Logger.debug("Received Message - Type: #{inspect(type)} -- Message: #{inspect(msg)}")
    {:ok, state}
  end

  def handle_cast({:send, {type, msg} = frame}, state) do
    Logger.debug("Sending #{type} frame with payload: #{msg}")
    {:reply, frame, state}
  end
end
기본 구현이 금방 끝나서 허탈하기까지 했다. WebSockex.start_link/4 함수 첫 번째 인자로 넘긴 주소로 웹소켓 연결을 만들어준다. 재연결 로직을 구현해서 사용자 입장에서 재연결을 신경 쓰지 않아도 된다. handle_connect/2, handle_disconnect/2 콜백 함수로 연결이 됐을 때, 끊겼을 때 뭔가를 할 수도 있다. 웹소켓으로 메시지를 보내는 send_message/1 함수를 추가했다.
iex> msg = ~s([{"ticket":"test"},{"type":"ticker","codes":["KRW-BTC"]}])
"[{\"ticket\":\"test\"},{\"type\":\"ticker\",\"codes\":[\"KRW-BTC\"]}]"
iex> ExampleWebsocketUpbit.Client.send_message(msg)
22:41:45.168 [debug] Sending text frame with payload: [{"ticket":"test"},{"type":"ticker","codes":["KRW-BTC"]}]

22:41:45.179 [debug] Received Message - Type: :binary -- Message: "{\"type\":\"ticker\",\"code\":\"KRW-BTC\",\"opening_price\":74607000.0,\"high_price\":74880000.0,\"low_price\":73480000.0,\"trade_price\":74013000.0,\"prev_closing_price\":74600000.00000000,\"acc_trade_price\":283870530756.946820000,\"change\":\"FALL\",\"change_price\":587000.00000000,\"signed_change_price\":-587000.00000000,\"change_rate\":0.0078686327,\"signed_change_rate\":-0.0078686327,\"ask_bid\":\"ASK\",\"trade_volume\":0.0014921,\"acc_trade_volume\":3829.98191427,\"trade_date\":\"20211104\",\"trade_time\":\"134143\",\"trade_timestamp\":1636033303000,\"acc_ask_volume\":2067.31414316,\"acc_bid_volume\":1762.66777111,\"highest_52_week_price\":81994000.00000000,\"highest_52_week_date\":\"2021-04-14\",\"lowest_52_week_price\":15431000.00000000,\"lowest_52_week_date\":\"2020-11-04\",\"market_state\":\"ACTIVE\",\"is_trading_suspended\":false,\"delisting_date\":null,\"market_warning\":\"NONE\",\"timestamp\":1636033303984,\"acc_trade_price_24h\":494207644236.54702000,\"acc_trade_volume_24h\":6676.73472997,\"stream_type\":\"SNAPSHOT\"}"
JSON 객체로 요청을 만들어야 한다. WebSocket을 이용한 업비트 시세 수신 페이지를 보고 키와 값을 채워서 요청을 보냈다. websockex 라이브러리 편하게 잘 만들었다. 시시하게 느껴질 정도로 쉽게 붙였다.
UUID 사용과 Jason 라이브러리로 편하게 JSON 인코딩, 디코딩 - commit d671d58
iex> msg = ~s([{"ticket":"test"},{"type":"ticker","codes":["KRW-BTC"]}])
"[{\"ticket\":\"test\"},{\"type\":\"ticker\",\"codes\":[\"KRW-BTC\"]}]"
이렇게 string으로 JSON 객체를 만드는 건 괴로우니 Jason 라이브러리를 사용해 elixir 데이터 타입과 JSON 객체 사이 변환을 한다.
defmodule ExampleWebsocketUpbit.Client do
  def request_tickers(tickers) do
    [
      %{ticket: UUID.uuid4()},
      %{type: "ticker", codes: tickers}
    ]
    |> Jason.encode!()
    |> send_message()
  end
end
Json.encode!/1 함수를 호출하면 된다.
일반적으로 용도를 식별하기 위해 ticket이라는 필드 값이 필요합니다.
이 값은 시세를 수신하는 대상을 식별하며 되도록 유니크한 값을 사용하도록 권장합니다. (UUID 등)
권고에 따라 ticket 필드 값으로 UUID를 생성해서 넘겼다.
def handle_frame({type, msg}, state) do
  msg = Jason.decode!(msg)
  Logger.debug("Received Message - Type: #{inspect(type)} -- Message: #{inspect(msg)}")
end
수신한 JSON 객체는 Jason.decode!/1 함수를 사용해 elixir 데이터 타입으로 디코딩해서 출력한다.
iex> ExampleWebsocketUpbit.Client.request_tickers(["KRW-BTC", "KRW-ETH"])
[debug] Sending text frame with payload: [{"ticket":"f1307923-4476-4442-abe0-80f389a8c22d"},{"codes":["KRW-BTC","KRW-ETH"],"type":"ticker"}]

23:06:19.161 [debug] Received Message - Type: :binary -- Message: %{"acc_bid_volume" => 2129.91644827, "timestamp" => 1636985177643, "lowest_52_week_price" => 1.7545e7, "trade_date" => "20211115", "ask_bid" => "ASK", "market_warning" => "NONE", "trade_volume" => 0.01389167, "signed_change_rate" => -0.0046526289, "type" => "ticker", "change_rate" => 0.0046526289, "prev_closing_price" => 7.931e7, "highest_52_week_price" => 8.27e7, "signed_change_price" => -3.69e5, "delisting_date" => nil, "trade_time" => "140617", "acc_trade_volume" => 4614.4718135, "stream_type" => "SNAPSHOT", "acc_trade_volume_24h" => 5867.06487825, "low_price" => 7.8895e7, "code" => "KRW-BTC", "acc_ask_volume" => 2484.55536523, "acc_trade_price" => 366714557133.2387, "trade_price" => 7.8941e7, "acc_trade_price_24h" => 464826538077.8125, "trade_timestamp" => 1636985177000, "highest_52_week_date" => "2021-11-09", "change_price" => 3.69e5, "opening_price" => 7.9323e7, "lowest_52_week_date" => "2020-11-15", "is_trading_suspended" => false, "market_state" => "ACTIVE", "change" => "FALL", "high_price" => 8.025e7}
로그에 \ 문자가 섞인 문자열 대신 map이 보이니 고향에 온 것 같다.
PING PONG - commit a5a2977
23:16:15.507 [info]  Connected!
Interactive Elixir (1.12.3) - press Ctrl+C to exit (type h() ENTER for help)
iex(1)>
23:17:15.513 [info]  Disconnected!
iex(1)>
23:17:15.571 [info]  Connected!
iex(1)>
서버에서는 기본적으로 아무런 데이터도 수/발신되지 않은 채 약 120초가 경과하면 Idle Timeout으로 WebSocket Connection을 종료합니다.
이를 방지하기 위해 클라이언트에서 서버로 PING 메시지를 보내서 Connection을 유지하고, WebSocket 서버의 상태와 WebSocket Connection Status를 파악할 수 있습니다.
현재 업비트 OpenAPI WebSocket 서버에서는 PING Frame 수신 대응 준비가 되어있는 상황이며, 클라이언트에서 간단한 구현으로 PING 요청/PONG 응답(PING에 대한 응답 Frame)을 통해 서버의 상태를 파악할 수 있습니다.
에이 약 120초가 아니라 60초구만 뭘. websockex 라이브러리에서 연결이 끊어지면 연결해 주지만 ping frame을 보내면 연결을 유지할 수 있으니 보내는 게 좋겠다. 30초 간격으로 ping frame을 보낸다.
30초 간격 타이머를 등록하면 된다. 어디에서 등록하고 해제하면 될까?
프로세스 시작 후 호출하는 GenServer.init/1 콜백이 있으면 등록하면 될 것 같다. 하지만 웹소켓 라이브러리로 사용중인 websockex 라이브러리에서 GenServer.init/1 콜백과 비슷한 타이밍에 호출하는 콜백을 제공하지 않는다. 연결 관련 콜백은 제공한다. 생각해보면 ping frame을 보내는 건 연결이 됐을 때만 의미가 있다. ping frame을 보내는 타이머를 연결이 됐을 때, 시작하고 연결이 끊기면 중지하는 코드를 추가했다.
defmodule ExampleWebsocketUpbit.Client do
  def handle_connect(_conn, state) do
    Logger.notice("Connected!")

    nil = state.ping_tick_timer
    # @ping_interval_ms 주기로 현재 프로세스에 tick 메시지를 보낸다
    {:ok, timer} = :timer.send_interval(@ping_interval_ms, self(), :tick) #<-- 1
    # timer 레퍼런스를 업데이트한다. 이후 접속이 끊길 때, 이 정보로 타이머를 취소한다.
    {:ok, put_in(state.ping_tick_timer, timer)}
  end

  def handle_disconnect(_conn, state) do
    Logger.notice("Disconnected!")

    # timer 레퍼런스를 사용해 취소한다
    {:ok, :cancel} = :timer.cancel(state.ping_tick_timer) #<-- 2
    {:ok, put_in(state.ping_tick_timer, nil)}
  end

  def handle_info(:tick, state) do
    Logger.debug("Sending ping frame")
    {:reply, :ping, state} #<-- 3
  end
end
1번 코드에서 :tick 메시지를 30초마다 자신에게 보내는 타이머를 등록한다. 연결이 끊겼을 때는 2번 코드로 타이머를 중지한다. :tick 메시지가 오면 3번 코드가 실행되는데, :reply 애텀(atom)으로 시작하는 튜플을 리턴하면 튜플 두 번째 요소를 서버로 전송한다. 즉, ping frame을 전송한다.
telemetry, prometheus.ex 라이브러리로 보고 싶은 메트릭 수집 - commit 2a07fe3
메트릭을 prometheus.ex 라이브러리를 사용해 바로 수집해도 되지만 메트릭 수집에 표준처럼 사용되는 telemetry를 거치게 했다. 괜히 복잡성을 높이는 것처럼 보일 수도 있다. 하지만 표준처럼 사용되고 있어서 telemetry를 무조건 거치는 게 유리하다. 글을 쓰는 현재 websockex 라이브러리에서 master 브랜치에 telemetry event를 구현했다. 릴리즈가 안 돼서 사용은 못 하지만 0.4.3 이후 버전에는 적용될 것 같다. DB 접근 라이브러리로 사용하는 ecto도 그렇고 라이브러리에서 제공하는 메트릭은 대부분 telemetry 라이브러리를 사용한다.
defmodule ExampleWebsocketUpbit.Telemetry do
  use Prometheus.Metric
  require Logger

  def init() do
    :ok =
      # 이벤트 이름과 이벤트 핸들러를 설정한다
      :telemetry.attach_many(
        "websockex-telemetry",
        [
          [:connected],     #<-- 1
          [:disconnected],  #<-- 1
          [:frame, :received] #<-- 2
        ],
        &ExampleWebsocketUpbit.Telemetry.handle_event/4,
        nil
      )

    # prometheus 메트릭을 정의한다
    Summary.declare(name: :received_size_bytes, help: "received size in bytes") #<-- 2
    Counter.declare(name: :connection_total, help: "connection total") #<-- 1
    Counter.declare(name: :disconnection_total, help: "disconnection total") #<-- 1

    Counter.declare(
      name: :received_ticker_total,
      help: "received ticker total",
      labels: [:ticker]
    ) #<-- 3

    :prometheus_httpd.start()
  end

  def handle_event([:frame, :received], %{size: size, ticker: ticker}, _metadata, _config) do
    Summary.observe([name: :received_size_bytes], size) #<-- 2
    Counter.inc(name: :received_ticker_total, labels: [ticker]) #<-- 3
  end

  def handle_event([:connected], _measurements, _metadata, _config) do #<-- 1
    Counter.inc(name: :connection_total)
  end

  def handle_event([:disconnected], _measurements, _metadata, _config) do #<-- 1
    Counter.inc(name: :disconnection_total)
  end
end
1번 코드로 연결, 연결 끊어짐 횟수를 수집한다. 2번 코드로 수신한 시세 메시지의 전체 크기를 수집한다. 코인별 수집 횟수도 보고 싶어서 3번 코드를 추가했다. 크기를 수집하려고 summary 메트릭 타입을 사용하고 있어서 이걸로 해보려고 했는데, counter 메트릭 타입처럼 레이블(label)을 지원하지 않아서 counter 메트릭 타입을 추가했다. 레이블로 코인 ticker를 넘기면 ticker 별 카운팅을 해서 편하게 사용했다.
defmodule ExampleWebsocketUpbit.Client do
  def handle_connect(_conn, state) do
    :telemetry.execute([:connected], %{time: System.system_time()})
    #...
  end

  def handle_disconnect(_conn, state) do
    :telemetry.execute([:disconnected], %{time: System.system_time()})
    #...
  end

  def handle_frame({_type, org_msg}, state) do
    msg = Jason.decode!(org_msg)

    :telemetry.execute([:frame, :received], %{
                         time: System.system_time(),
                         size: byte_size(org_msg),
                         ticker: msg["code"] #<-- 1
                       })

    {:ok, state}
  end
end
위 ExampleWebsocketUpbit.Telemetry 모듈에서 정의한 telemetry 이벤트를 상황에 맞게 내보내면 된다. 1번 코드로 수신한 코인 ticker를 전달한다.
import Config

# https://github.com/deadtrickster/prometheus-httpd/blob/master/doc/prometheus_httpd.md
config :prometheus, :prometheus_http,
  path: String.to_charlist("/metrics"),
  format: :auto,
  port: 8081
http 서버 세팅을 한다. 수집한 메트릭을 prometheus 리포트 형식으로 서빙해서 집계하고 시각화하는 서비스에서 가져갈 수 있도록 한다.
$ iex -S mix
iex> ExampleWebsocketUpbit.Client.request_tickers(["KRW-BTC", "KRW-ETH"])
프로그램을 실행하고 비트코인과 이더리움 시세를 가져온다.
# TYPE connection_total counter
# HELP connection_total connection total
connection_total 1
# TYPE disconnection_total counter
# HELP disconnection_total disconnection total
disconnection_total 0
# TYPE received_ticker_total counter
# HELP received_ticker_total received ticker total
received_ticker_total{ticker="KRW-ETH"} 348
received_ticker_total{ticker="KRW-BTC"} 513
# TYPE telemetry_scrape_encoded_size_bytes summary
# HELP telemetry_scrape_encoded_size_bytes Scrape size, encoded
telemetry_scrape_encoded_size_bytes_count{registry="default",content_type="text/plain; version=0.0.4",encoding="gzip"} 21
telemetry_scrape_encoded_size_bytes_sum{registry="default",content_type="text/plain; version=0.0.4",encoding="gzip"} 146785
# TYPE telemetry_scrape_duration_seconds summary
# HELP telemetry_scrape_duration_seconds Scrape duration
telemetry_scrape_duration_seconds_count{registry="default",content_type="text/plain; version=0.0.4"} 21
telemetry_scrape_duration_seconds_sum{registry="default",content_type="text/plain; version=0.0.4"} 0.338877
# TYPE telemetry_scrape_size_bytes summary
# HELP telemetry_scrape_size_bytes Scrape size, not encoded
telemetry_scrape_size_bytes_count{registry="default",content_type="text/plain; version=0.0.4"} 21
telemetry_scrape_size_bytes_sum{registry="default",content_type="text/plain; version=0.0.4"} 2301304
# TYPE received_size_bytes summary
# HELP received_size_bytes received size in bytes
received_size_bytes_count 861
received_size_bytes_sum 826622
...
nil 페이지를 방문하면 수집한 메트릭을 볼 수 있다.
promethus, grafana - commit 86009f5
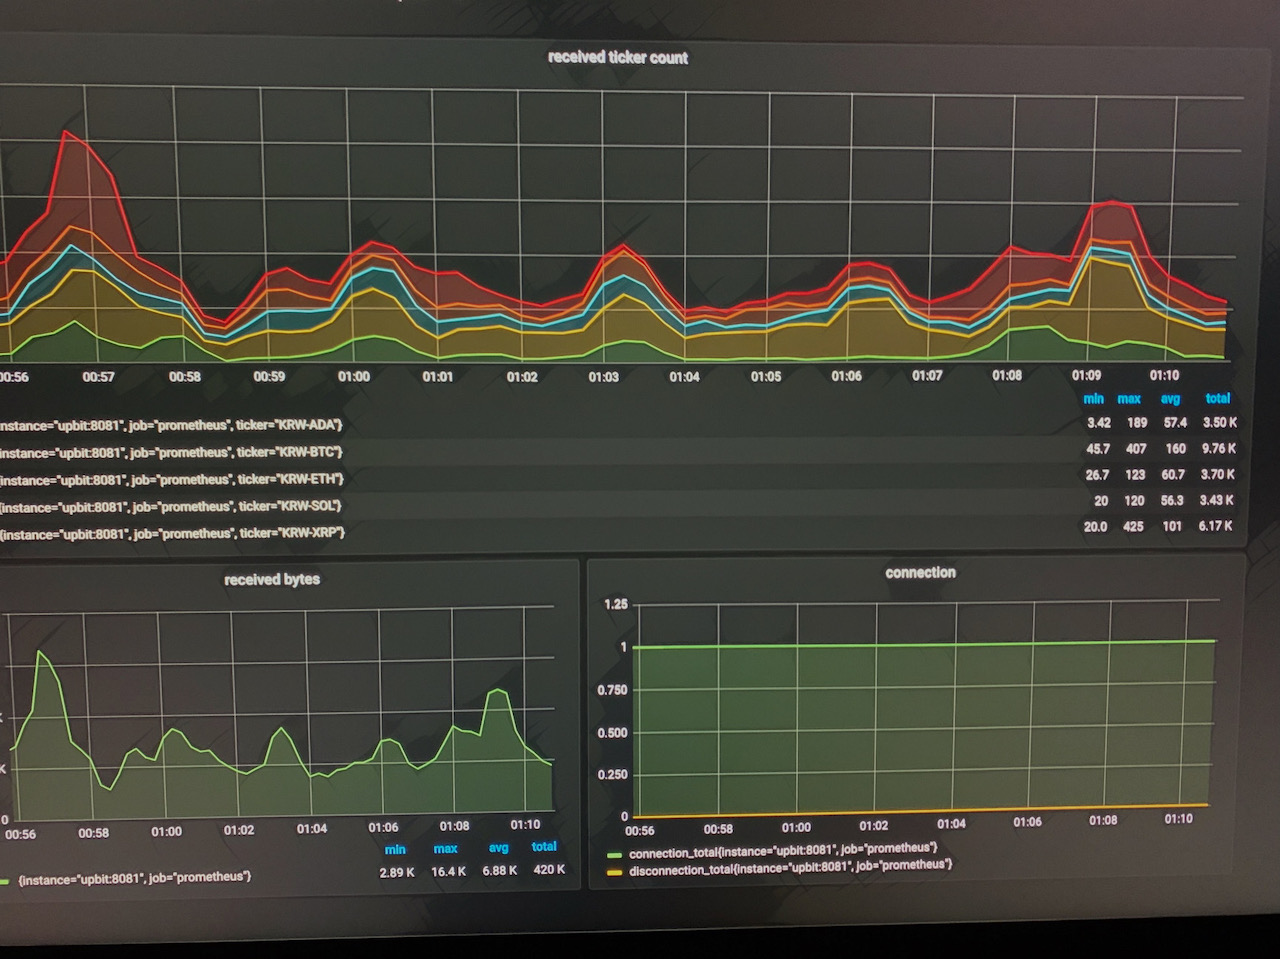
prometheus 시계열 데이터베이스(time series database)를 사용해서 메트릭을 보관하고 grafana를 사용해 시각화한다. docker compose를 사용해 upbit 시세 스크레이퍼 프로그램과 prometheus, grafana를 모두 실행한다.
’prometheus, grafana - elixir로 비트코인 시세 스크랩 (feat. 업비트) 3/3’ 글을 적으며 사용했던 코드를 재사용했다.
마치며
upbit에 HTTP 요청으로 획득할 수 있는 최소 단위는 1분이다. 실시간 시세를 받아보려면 웹 스크레이핑 같은 걸 해야 하는데, 다행히 웹소켓으로 실시간 시세를 제공해서 예제 프로그램을 작성해봤다.
웹소켓을 사용한 예제 프로그램은 금방 작성했는데, grafana로 시각화하는데 시간을 많이 썼다. 어떤 메트릭을 수집할 것인가? 어떻게 시각화를 할 것인가? 두 질문에 대한 답을 할 수 있어야 한다. 첫 번째는 몇 번 해보니 나아졌다. 두 번째는 좀처럼 늘지 않는다. 잘 만든 grafana 대시보드를 부지런히 베껴야겠다.
전체 소스 코드는 https://github.com/ohyecloudy/example_websocket_upbit 에서 볼 수 있다.