
prometheus, grafana - elixir로 비트코인 시세 스크랩 (feat. 업비트) 3/3
- GenStage - elixir로 비트코인 시세 스크랩 (feat. 업비트) 1/3
- JWT - elixir로 비트코인 시세 스크랩 (feat. 업비트) 2/3
- prometheus, grafana - elixir로 비트코인 시세 스크랩 (feat. 업비트) 3/3
GenStage 라이브러리로 생산자와 소비자를 구현했다. 소비자는 업비트 Open API를 사용해 비트코인 시세를 가져오게 했다. 초당 요청 횟수 제한이 있어서 1초마다 생산자에게 10개의 이벤트를 요청한다.
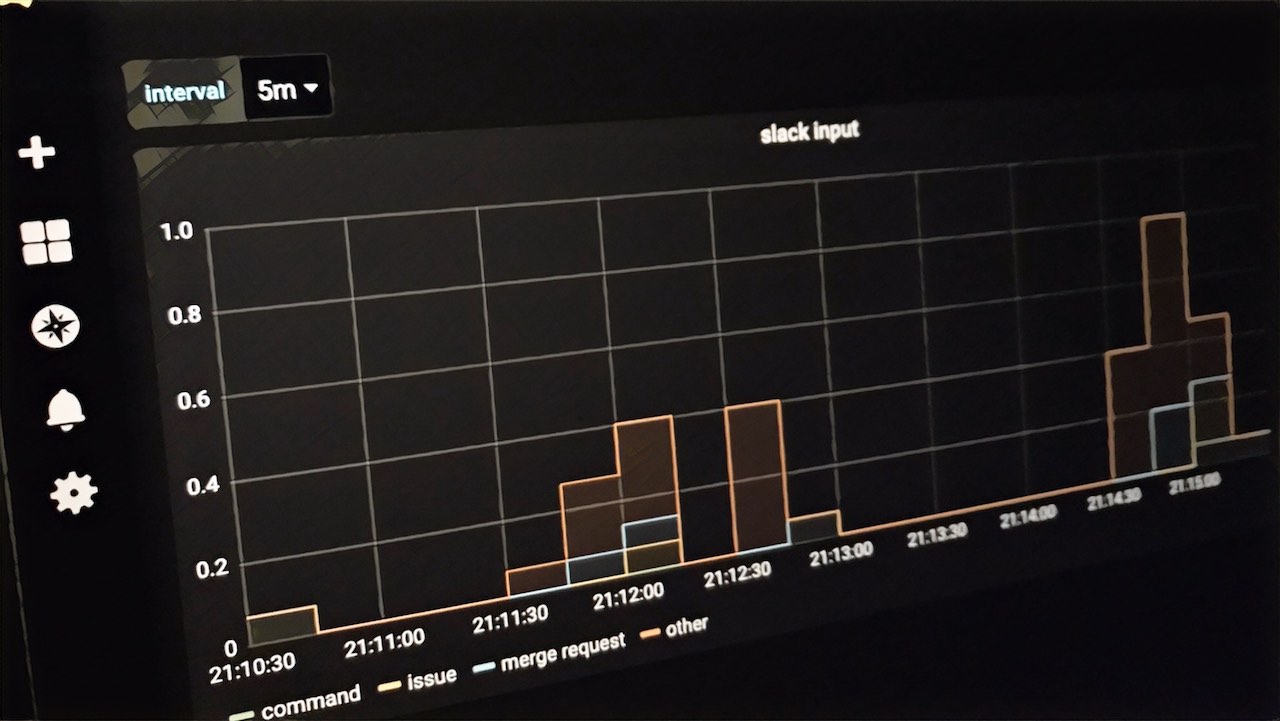
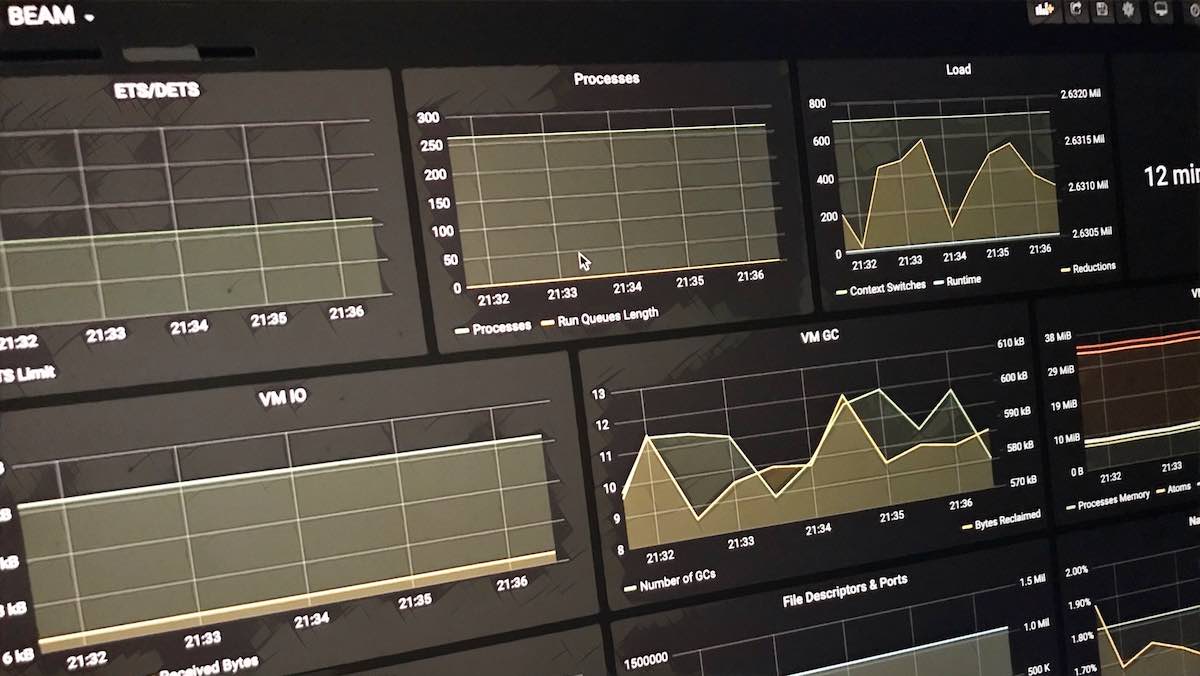
콘솔 로그로 확인하고 마무리해도 되지만 이왕 하는 김에 그래프로 진행 상황을 보고 싶어서 추가 작업을 진행한다. 시계열 데이터베이스(time series database)로 prometheus를 사용하고 시각화 도구로 grafana를 사용했다.
telemetry, prometheus_ex 라이브러리로 보고 싶은 메트릭 수집 commit c0d7a53
defmodule BitcoinPriceScraper.Metrics.Handler do
  use Prometheus.Metric

  def start() do
    counters = [
      [:upbit, :quotation, :request, :new],
      [:upbit, :quotation, :request, :retry],
      [:upbit, :quotation, :response, :success],
      [:upbit, :quotation, :response, :failed]
    ]

    :telemetry.attach_many("upbit-counters", counters, &handle_event_counter/4, nil) # <--- 1

    counters
    |> Enum.each(fn name ->
      Counter.declare(
        name: counter_name(name),
        help: inspect(name)
      )
    end)

    summaries = [
      [:upbit, :quotation, :request, :success, :duration, :milliseconds],
      [:upbit, :quotation, :request, :failed, :duration, :milliseconds]
    ]

    :telemetry.attach_many("upbit-summaries", summaries, &handle_event_summary/4, nil) # <--- 2

    summaries
    |> Enum.each(fn name ->
      Summary.declare(
        name: name(name),
        help: inspect(name),
        duration_unit: :milliseconds
      )
    end)
  end

  def handle_event_counter(event_name, %{count: count}, _metadata, _config) do
    Counter.inc([name: counter_name(event_name)], count) # <--- 3
  end

  def handle_event_summary(event_name, %{duration: duration_native}, _metadata, _config) do
    Summary.observe([name: name(event_name)], duration_native) # <--- 4
  end

  defp counter_name(event_name) do
    :"#{name(event_name)}_total"
  end

  defp name(event_name) do
    event_name |> Enum.join("_")
  end
end
새로운 시세 조회 요청 개수, 재시도 요청 개수, 성공한 조회 요청 응답, 실패한 조회 요청 응답을 counter 타입으로 1번 코드로 추가했다. 3번 코드로 prometheus 포맷으로 출력할 수 있게 처리한다. 시간도 궁금해서 성공한 조회 요청 응답에 걸린 시간과 실패한 조회 요청 응답 시간을 2번 코드로 추가하고 4번 코드로 prometheus 포맷으로 출력할 수 있게 했다.
:telemetry.execute([:upbit, :quotation, :request, :retry], %{
                     count: Enum.count(producers[from].pending)
                   })

:telemetry.execute([:upbit, :quotation, :request, :new], %{count: Enum.count(events)})
:telemetry.execute([:upbit, :quotation, :response, :success], %{count: 1})

:telemetry.execute(
  [:upbit, :quotation, :request, :success, :duration, :milliseconds],
  %{duration: System.monotonic_time() - before_request}
)

:telemetry.execute([:upbit, :quotation, :response, :failed], %{count: 1})

:telemetry.execute(
  [:upbit, :quotation, :request, :failed, :duration, :milliseconds],
  %{duration: System.monotonic_time() - before_request}
)
메트릭 수집이 필요한 곳에 :telemetry.execute/2 함수를 추가했다. BitcoinPriceScraper.Metrics.Handler 모듈에서 등록한 핸들러 코드를 바로 호출한다.
config :prometheus, :prometheus_http,
  path: String.to_charlist("/metrics"),
  format: :auto,
  port: 8081
config.exs 파일에 웹서버 포트와 경로를 정의한다. prometheus에서 localhost:8081/metrics 주소를 폴링(polling) 하면 된다.
defmodule BitcoinPriceScraper.Metrics do
  alias BitcoinPriceScraper.Metrics.Handler

  def start() do
    :prometheus_httpd.start() # <--- 1
    Handler.start() # <--- 2
  end
end
1번 코드로 웹서버를 시작한다. 2번 코드로 위에 BitcoinPriceScraper.Metrics.Handler 모듈에 정의한 telemetry 이벤트 핸들러를 등록한다.
# TYPE upbit_quotation_response_success_total counter
# HELP upbit_quotation_response_success_total [:upbit, :quotation, :response, :success]
upbit_quotation_response_success_total 313
# TYPE upbit_quotation_response_failed_total counter
# HELP upbit_quotation_response_failed_total [:upbit, :quotation, :response, :failed]
upbit_quotation_response_failed_total 7
# TYPE upbit_quotation_request_new_total counter
# HELP upbit_quotation_request_new_total [:upbit, :quotation, :request, :new]
upbit_quotation_request_new_total 313
# TYPE upbit_quotation_request_retry_total counter
# HELP upbit_quotation_request_retry_total [:upbit, :quotation, :request, :retry]
upbit_quotation_request_retry_total 7
# TYPE upbit_quotation_request_success_duration_milliseconds summary
# HELP upbit_quotation_request_success_duration_milliseconds [:upbit, :quotation, :request, :success, :duration, :milliseconds]
upbit_quotation_request_success_duration_milliseconds_count 313
upbit_quotation_request_success_duration_milliseconds_sum 6895.41605
# TYPE upbit_quotation_request_failed_duration_milliseconds summary
# HELP upbit_quotation_request_failed_duration_milliseconds [:upbit, :quotation, :request, :failed, :duration, :milliseconds]
upbit_quotation_request_failed_duration_milliseconds_count 7
upbit_quotation_request_failed_duration_milliseconds_sum 80.475664
...
실행 후 localhost:8081/metrics 페이지를 방문해본다. 잘 나온다.
docker compose를 사용해 prometheus와 grafana 실행 commit 98d3926
version: '3'
services:
  scraper:
    build:
      context: ..
      dockerfile: script/Dockerfile-scraper
    environment:
    - TZ=Asia/Seoul
    ports:
    - "8081:8081"
  prometheus:
    build:
      context: .
      dockerfile: ./Dockerfile-prometheus
    ports:
    - "9090:9090"
    depends_on:
    - scraper
    volumes:
    - prometheus-data:/prometheus
  grafana:
    build:
      context: .
      dockerfile: ./Dockerfile-grafana
    ports:
    - "3000:3000"
    depends_on:
    - prometheus
volumes:
  prometheus-data:
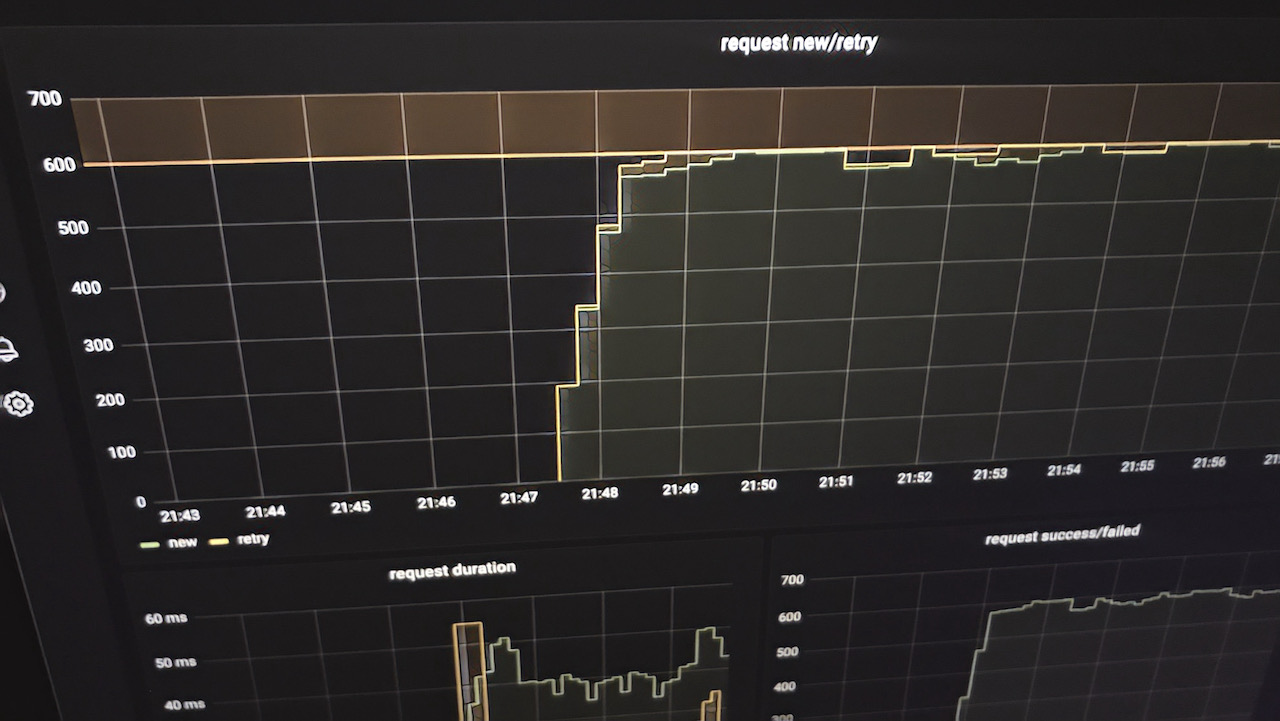
script/docker-compose.yml 파일을 만들었다. 비트코인 시세 스크랩 프로그램, prometheus, grafana를 실행한다. Provisioning Grafana 사이트, prometheus installation 페이지를 참고해서 프로비저닝(provisioning) 파일을 미리 만들어서 docker compose로 실행 후 바로 결과를 볼 수 있게 했다.
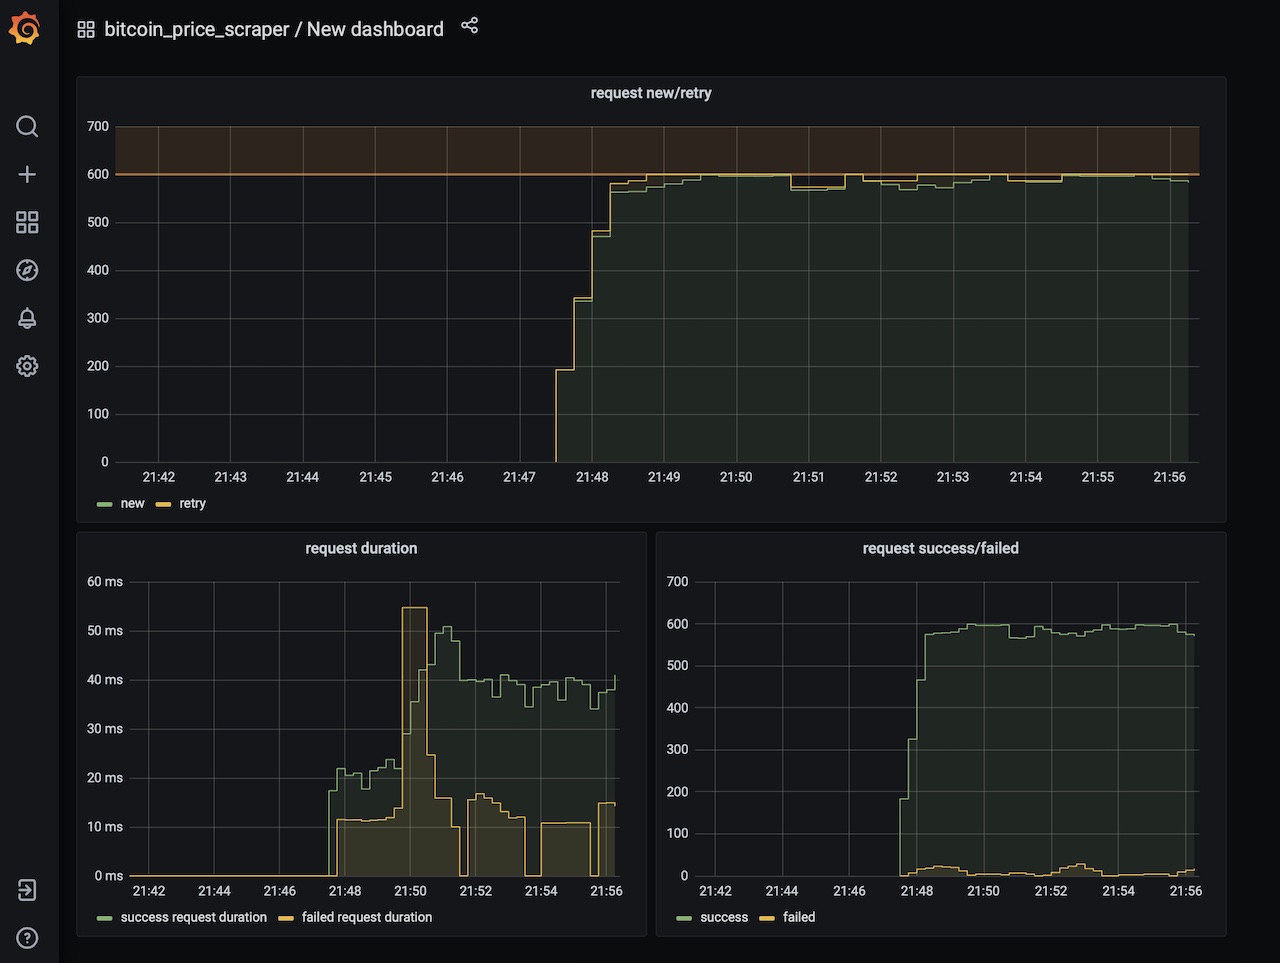
잘 나온다. HTTP 요청을 보내고 응답을 받아서 파싱하는 시간이 오래 걸려 초당 요청 제한 횟수를 못 채우면 소비자를 프로세스 여러 개로 쪼개서 알뜰하게 요청하려고 했는데, 그럴 필요는 없겠다.
hadolint 도커 linter 결과 적용 commit 8262763
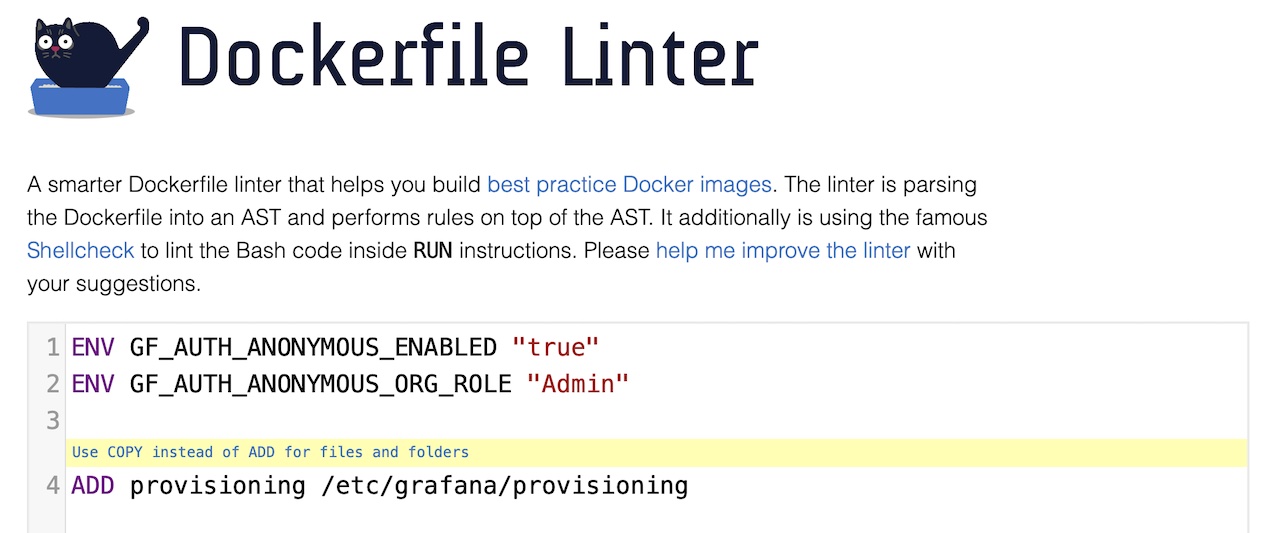
https://hadolint.github.io/hadolint/ 사이트에서 docker 파일을 검사해봤다. ADD 명령은 tar 파일이 있으면 자동으로 압축을 푸는 동작까지 하니깐 압축 푸는 동작이 필요하지 않으면 COPY 명령을 사용하라고 한다. 맞다. 압축 푸는 기능은 필요 없다. 그래서 ADD 명령을 COPY 명령으로 변경했다.
마치며
업비트 Open API를 사용해 비트코인 시세를 스크랩하는 프로그램의 각종 메트릭을 prometheus, grafana 스택을 사용해 시각화했다. docker compose를 사용해 간편하게 바로 실행할 수 있게 했다.
전체 코드는 ohyecloudy/bitcoin_price_scraper 깃헙 사이트에서 볼 수 있다.
이 글과 관련된 커밋 목록이다.
-
c0d7a53
 telemetry, prometheus
 -
98d3926
 grafana, prometheus로 메트릭 수집 및 조회
 -
8262763
 docker ADD 명령어 대신 COPY 명령어 사용